Mastering Microsoft Excel

Practical Applications, Formulas & Visualization Techniques
This guide offers an interactive, hands-on approach to effectively use Microsoft Excel. Instead of just reading, you'll engage with practical examples and learn the core tools needed to analyze, manage, and visualize data effectively. From basic formulas to powerful automations, this guide will help you to master Excel.
What is Excel?
Microsoft Excel is a powerful spreadsheet application used for organizing, analyzing, and visualizing data. It is part of the Microsoft 365 suite and is widely recognized for its grid of rows and columns, known as a worksheet. The fundamental unit of a worksheet is a cell, where you can enter data, formulas, or functions. Excel's core strength lies in its ability to automatically perform calculations, which makes it a critical tool for everything from simple calculations to complex data analysis.
Prepared by: Vishnu Gautam
Mastering Microsoft Excel
Why Excel Matters
- Widely used across industries for:
- Data analysis
- Financial modeling
- Reporting and dashboards
- Engineering Calculations
- Project management
- Integrates well with other Microsoft tools (Power BI, Outlook, Teams)

Mastering Microsoft Excel
Common Applications of Excel
Excel is a universal tool used across all business functions:
- Engineering: Calculations, BOQ, Doc Management
- Finance: Budgeting, Forecasting, Expense tracking
- Operations: Inventory management, Scheduling
- Sales & Marketing: CRM tracking, Campaign analysis
- HR: Employee databases, Leave tracking
- Project Management: Gantt charts, Timelines
Mastering Microsoft Excel
Useful Excel Formulas
Here are some essential formulas with examples:
| Formula | Purpose | Example |
|---|---|---|
| `=SUM()` | Adds values | `=SUM(A1:A10)` |
| `=AVERAGE()` | Calculates mean | `=AVERAGE(B1:B10)` |
| `=IF()` | Conditional logic | `=IF(C2>100,"High","Low")` |
| `=VLOOKUP()` | Lookup value vertically | `=VLOOKUP(101,A2:D100,2,FALSE)` |
| `=INDEX() & MATCH()` | Advanced lookup | `=INDEX(B2:B10,MATCH("Apple",A2:A10,0))` |
| `=COUNTIF()` | Count based on condition | `=COUNTIF(A1:A10,">50")` |
| `=TEXT()` | Format numbers/dates | `=TEXT(TODAY(),"dd-mm-yyyy")` |
Mastering Microsoft Excel
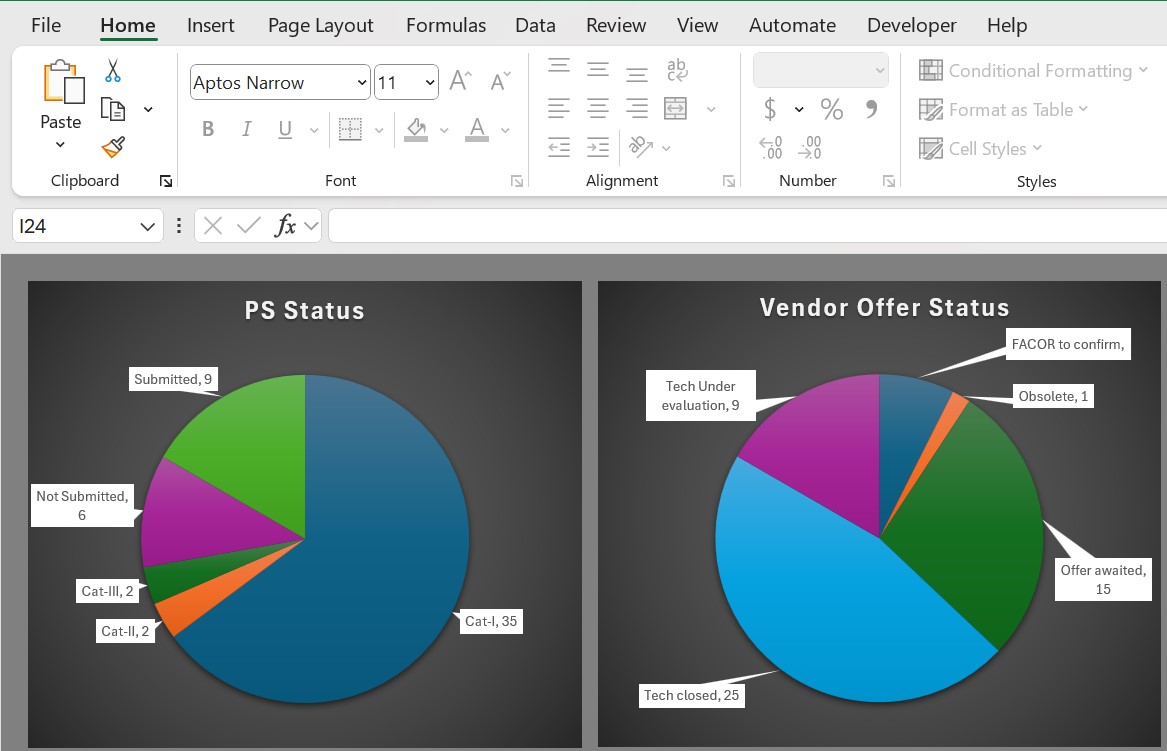
Data Visualization with Charts
Types of Charts:
- Column Chart: Compare values across categories
- Line Chart: Show trends over time
- Pie Chart: Show proportions
- Bar Chart: Horizontal comparison
- Scatter Plot: Show relationships between variables
How to Create a Chart:
- Select your data
- Go to Insert > Charts
- Choose the chart type
- Customize with titles, labels, colors

Mastering Microsoft Excel
Tips for Effective Excel Usage
- Use Named Ranges for clarity in formulas.
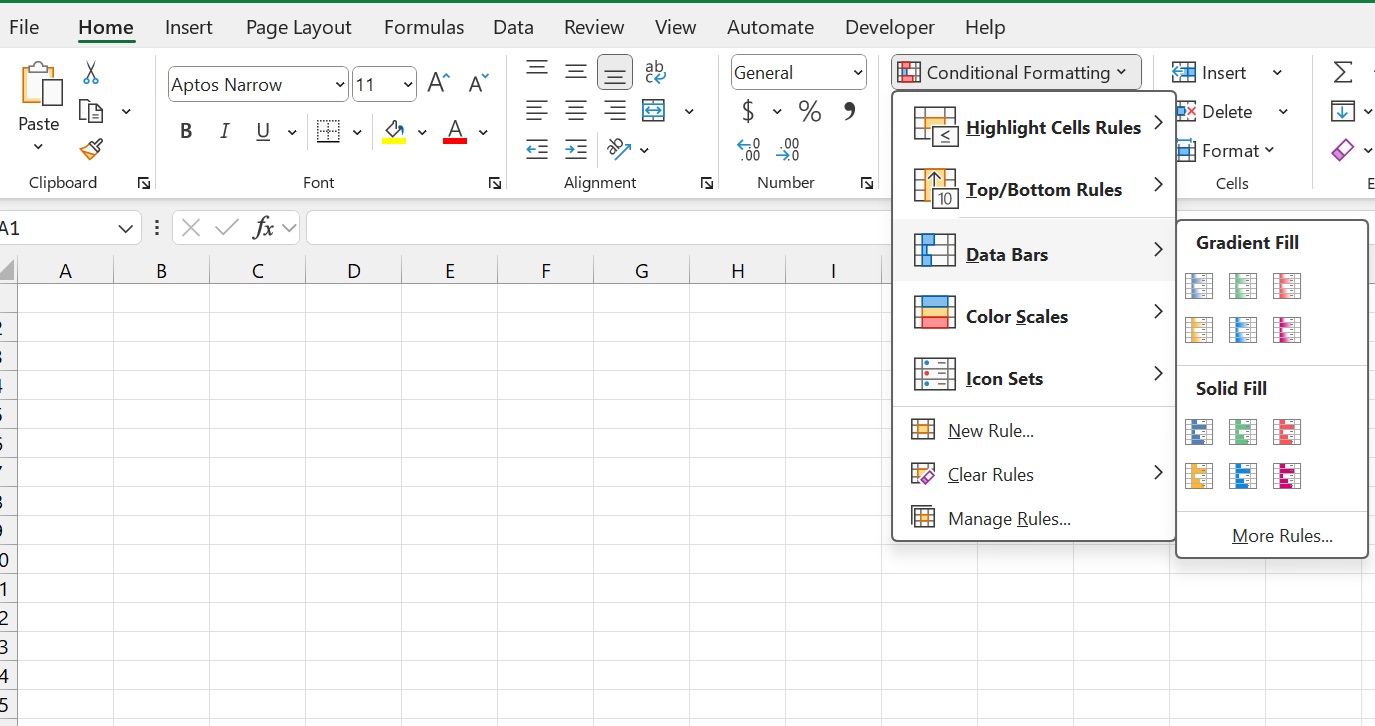
- Apply Conditional Formatting to highlight key data (as shown in the image).
- Use Tables (Ctrl+T) for dynamic ranges and auto-filling formulas.
- Protect sheets to avoid accidental edits.
- Use PivotTables for quick and interactive summaries of large datasets.
Mastering Microsoft Excel
Advanced Features to Explore
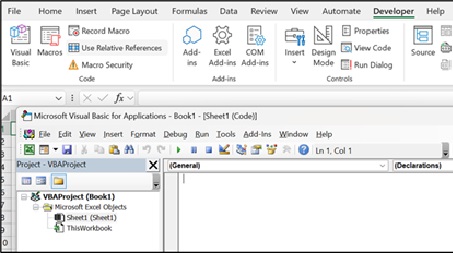
- VBA & Macros: Use Visual Basic for Applications to write code that automates repetitive tasks.
- Power Pivot: A data modeling tool for creating complex data models and running advanced calculations.
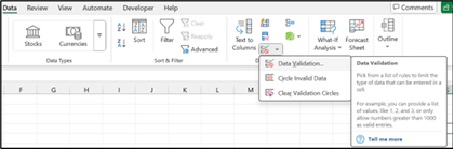
- Data Validation: Enforce rules on data entry (e.g., dropdown lists, date ranges) to ensure data integrity.
- Dynamic Arrays: Use modern functions like `FILTER()`, `SORT()`, and `UNIQUE()` to return multiple results automatically.
Mastering Microsoft Excel
Real-World Example: Monthly SCM Dashboard
Imagine a dashboard that summarizes your data and helps you visualize key metrics. Here’s how Excel tools come together:
- Use formulas like SUMIFS and COUNTIFS to aggregate data.
- Create PivotTables for project-wise or package-wise breakdowns.
- Insert slicers for interactive filtering by date or amount.
- Use dynamic charts to visualize package ordering trends over time.
Mastering Microsoft Excel
What Not to Do in Excel?
While Excel is a versatile tool, there are certain practices that can lead to errors, inefficiency, or make your work difficult to manage.
- Don't Hardcode Values in Formulas: Avoid typing numbers directly into a formula (e.g., =A1*1.05). Instead, reference a cell that contains the value (e.g., =A1*B1, where B1 holds the 1.05 value). This makes your spreadsheet more flexible and easier to update.
- Avoid Merging Cells: Merging cells can cause issues with sorting, filtering, and copying data. It's better to use "Center Across Selection" for formatting titles.
- Don't Use Excel as a Database: While it can store data, Excel is not a robust database. It lacks the relational capabilities and data integrity features of dedicated database management systems. For large or complex datasets, a database is a better choice.
- Don't Overly Complicate Your Worksheets: Using too many complex formulas or macros can make the file slow and prone to errors. Keep your sheets clean and simple, using multiple sheets to separate data, calculations, and final reports.
- Avoid Manual Formatting: Instead of manually changing colors, fonts, or cell borders, use Conditional Formatting to apply rules based on cell values. This ensures your formatting is dynamic and consistent.
- Don't Ignore Errors: Don't just dismiss error messages like #VALUE! or #REF!. They are indicators of problems in your formulas or data and should be investigated and corrected.
Mastering Microsoft Excel
Resources to Learn More
- Microsoft Excel Help Center
- YouTube channels (e.g., ExcelIsFun, Leila Gharani)
- LinkedIn Learning & Coursera courses
- Internal training materials or workshops
Mastering Microsoft Excel
Q&A / Discussion
Let's start discussion. Please share your thoughts on:
- How you currently use Excel
- Challenges you face
- Features you’d like to learn more about
Thank You!